Knowing about failures before the family does
When an infrastructure is used daily by a whole family, an outage stops being merely technical — somebody misses a film, somebody cannot find a document. A case study on what you have to measure to find out first, and why that differs from watching graphs. The same principle carries over to a small business.
Focus Area
Observability
Depth
Intermediate
Stack
A homelab breaks quietly
Nothing explodes. One evening the movie simply won't start, the shopping list stops syncing, or the morning reminder never arrives. In the beginning, my monitoring system was the family: utterly reliable, but it only reports after the failure — and usually at the least convenient moment.
With a handful of containers you can live like that. With a few dozen — databases, automations, and underneath — “it probably works” stopped being an answer. If I treat my home as a small production system, then a production system without monitoring is just guesswork asking for a disaster.
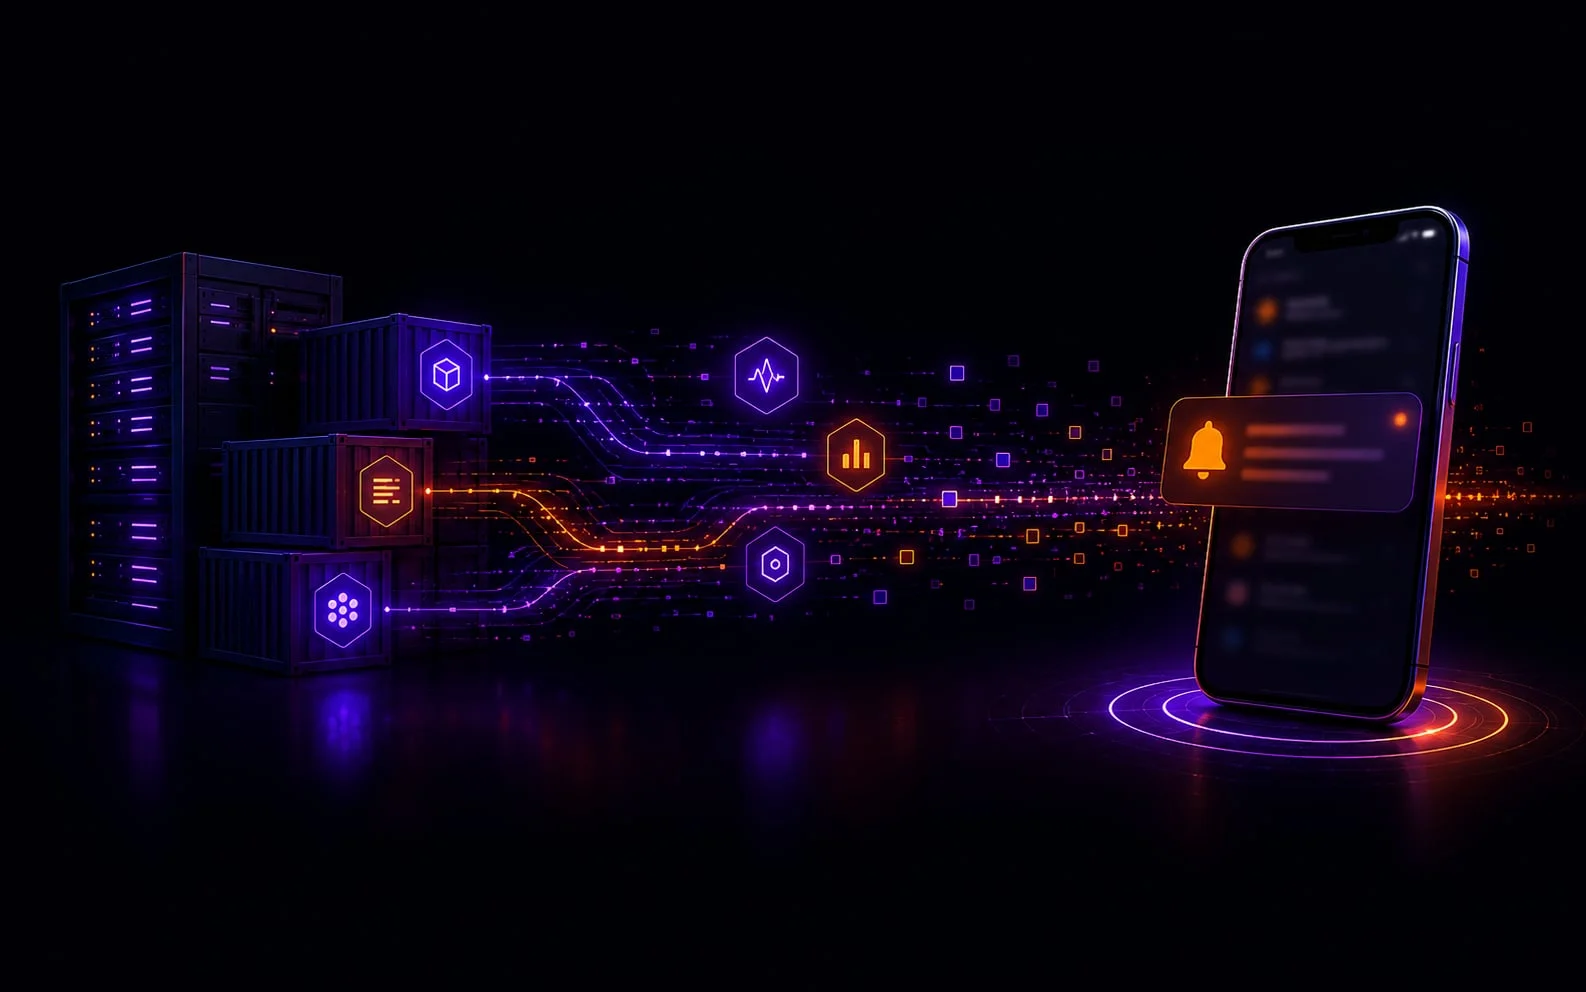
The observability stack: collects metrics, with Alloy handles logs, Alertmanager decides who gets notified and when, is the window onto all of it, and turns a raw alert into a message you can read on your phone. Everything in containers, everything local.
Three questions, three tools
The division of labor is simple. Metrics tell you that something is happening: a container is eating memory, a disk is filling up, response times are climbing. Logs tell you why. Alerts decide whether someone needs to know now, or whether the morning is soon enough.
The data flow is simpler than the number of names suggests. Every dozen or so seconds, Prometheus scrapes exporters for container, host, and per-service metrics; meanwhile Alloy reads the logs of every container and ships them to Loki. Alert rules live in the Prometheus configuration, and when one fires, Alertmanager picks the route — who should know, over which channel, and whether this hour is appropriate at all. The last leg, from a raw alert to a message a human wants to read, belongs to n8n.
Grafana is deliberately nothing more than a window in this chain. A dashboard nobody looks at isn't monitoring — it's a screensaver. The real work is done by alert rules, and those hurt the most. Each of the stories below is a false alarm that woke me up first and taught me second.
Lesson 1: metrics lie politely
The first version of my memory alert used container_memory_usage_bytes. It sounds like exactly what you need — and according to it, my ad blocker was consuming 433 MB, uncomfortably close to its limit. The catch: this metric includes the filesystem cache, which the kernel will happily hand back the moment anyone needs it. Actual usage, measured by container_memory_working_set_bytes, was 326 MB. A hundred megabytes of difference — and an alert crying wolf over memory that was reclaimable all along.
# Wrong: includes FS cache, inflated by 30-100%
container_memory_usage_bytes{name="adguard"}

# Right: the memory the container actually needs
container_memory_working_set_bytes{name="adguard"}
Lesson 2: the alert that never goes out
Counters in Prometheus only go up. A rule like “alert when the restart counter is greater than zero” looks innocent, but has an amusing property: a container that restarted once, three weeks ago, will satisfy it until the end of time. The alert lights up and never goes dark again.
# Wrong: true forever after the first restart
container_restart_count > 0

# Right: did a restart happen in the last 5 minutes
increase(container_restart_count[5m]) > 0
The question an alert should answer is not “has this ever happened” but “is this happening now.” The difference between those two queries is the difference between monitoring and a chronicle.
Lesson 3: the monitoring that monitored itself
The finest loop I ever built by accident. A Loki rule searched the logs for words that indicate killed processes — “oom” and “killed” among them. The thing is, Loki also logs its own queries. My query for “oom” landed in Loki's logs, where it was promptly found by the very rule that sent it. The monitoring successfully detected that it was monitoring.
Bonus: a bare “oom” without word boundaries also matches “Room” and “Zoom.” One container with a room name in its logs is enough to get an alert about a supposedly killed process.
# Right: word boundaries + exclude Loki's own logs
{job="containerlogs", container_name!="loki"} |~ "(?i)\\boom\\b|\\bkilled\\b"
An alert should be a message, not a stack dump
A raw Alertmanager alert reads like a message from one robot to another: labels, values, identifiers. At seven in the morning, on a phone, nobody reads that. So between Alertmanager and the phone sits n8n, which assembles the message from the rule's own annotations: what happened, which container is involved, and where to start. I write the sentence for a human once — at the rule — instead of having it composed anew at every alarm.
The route is short, but every stop has a job. Alertmanager fires a webhook to n8n, which normalizes labels and annotations from different rules into one format and asks a local model running in for a summary. The alert's severity is not the model's opinion — it comes from the rule's labels; the AI translates, it doesn't decide. The finished message reaches its recipient over their channel of choice: or Telegram.
Update, August 2026 — this section describes an earlier stage. For the first months a local model running in wrote the summary. After measuring it I removed it from the default path: the median notification took 123 seconds, one in three hit the timeout, and the model was essentially rewriting the sentence I had typed into the rule description myself. Today the message is assembled deterministically from the rule's annotations in tens of milliseconds, and the model is an option enabled by a label — none of the 73 active rules uses it. The measurement and the reasoning are in the post about alerts.
# An alert's route:
# Prometheus → Alertmanager → webhook → n8n
#   → normalize labels and annotations into one format
#   → message assembled from the rule's annotations (no model)
#   → per-user routing: ntfy | Telegram
#   → quiet hours: queue → delivery in the morning
The model runs on the server's CPU — summarizing an alert is not a conversation, so ten to a few dozen seconds is entirely enough. In exchange, no description of what happens in my house ever leaves the house. It's the same tradeoff I described with the AI agent in Home App: local AI is slower than a cloud API, but privacy outranks a few seconds here.
Beyond that, ordinary notification hygiene applies: critical alerts always get through, the rest respect quiet hours and wait in a queue until morning. A system that wakes people up over a non-critical rise in disk usage is asking to be muted — and muted monitoring is the most expensive kind of no monitoring at all.

Who watches the watchman
The worst-case scenario isn't a service failure. It's a monitoring failure — silence that looks like peace. For a while I lived believing that no alerts meant a healthy system, until I discovered it can also mean a dead notification channel.
The solution is as old as the railways: a dead-man's switch. One control signal is active at all times, but it doesn't wake a human every few minutes — it quietly confirms that the whole path, from Prometheus through n8n to the phone, works. Only its absence is an alarm. On top of that, a separate watchdog checks that scheduled jobs actually ran. Silence stopped being good news; good news is a regular pulse.
Same category: after a server reboot, the container metrics exporter can come up in a state where it reports nothing. Everything looks green, because there is no data that could be red. These are the things you only learn about when you monitor the monitoring, too.
In August, over the course of a single day, I got the green light three times even though something was broken. The database reported “accepting connections” even when the password was wrong. The application showed as “healthy,” while every attempt to open anything in it ended in an error. The check for whether the copies were up to date reported success because it found no copies at all: an empty list looked like “everything matches.” Each of these tools was telling the truth — just about something different from what I had asked. So before I decide that something works, I ask exactly what the green result checks, and whether it could ever turn red.
Tradeoffs
This stack isn't free. It's several extra containers, a noticeable slice of RAM, and rules that need to be maintained like code — mine live in a git repository, with change history and the reason for every tweak in the commit message. Without that, six months later nobody remembers why an alert has this particular threshold, or whether that threshold was wisdom or panic.
What changed
Three things are visible day to day. False alarms all but disappeared after the fixes described above — and the alerts that do arrive read like a message from a person, not a system dump. I learn about most failures from my phone before anyone at home has a chance to notice: a container that died overnight is described — and usually fixed — by morning, before anyone reaches for the shopping list. And a dead notification channel, once invisible for weeks, now reports itself by the absence of its pulse.
The family still reports bugs. Just no longer first.
What this stack taught me
That the hardest part of monitoring isn't collecting data — collecting is easy, containers will happily tell you everything about themselves. The hardest part is deciding what deserves someone's attention at three in the morning. Every one of my false alarms was, at its core, a wrong answer to that question.
And that monitoring is itself a service that breaks. Since the dead-man's switch took over guard duty, I trust the silence — but only because every few minutes, the silence signs its name.
Frequently asked questions
Isn't monitoring overkill for a home server?
As long as the server only serves you and runs five containers — maybe. But once the family depends on it, an outage stops being a hobby. Monitoring is the difference between fixing things quietly and explaining yourself after the fact.
Does any monitoring data leave for the cloud?
No. Metrics, logs, and alerts stay on the server at home. Even the alert summaries are written by a local language model — no description of what happens in my house ever reaches an external API.
Where do I start if I have nothing?
With healthchecks in Docker Compose and a single heartbeat signal that verifies your notification path actually works. Add alerts only once you know what your services look like on a normal day — otherwise you'll spend the first week turning off false alarms.